
Crop Metrics Glossary
This is the glossary of a selection of important data ‘Parameters’ used in IrriWatch. The parameters are categorised into Irrigation, Crop and Climate. The descriptions include an explanation of the parameter, a description of why it is useful as well as a possible example on how to use it.
This section covers the Crop Metrics.
Crop Growth/ Dry Matter Production
This is incremental dry matter production on a given day in terms of stem, leaves, grains, roots and tubers growth. It is used to monitor level of crop production and crop health throughout the cropping season but is also useful for understanding crop response to irrigation and other input factors.
The production during certain crop stages can be fundamental for determining certain agronomic processes and quality of the harvestable product. The accumulated value of dry matter production across the growing season is a good indicator for final crop yield (but requires conversion into harvestable portions from IW clients) and economic returns.
The production during certain crop stages can be fundamental for determining certain agronomic processes and quality of the harvestable product. The accumulated value of dry matter production across the growing season is a good indicator for final crop yield (but requires conversion into harvestable portions from IW clients) and economic returns.
Example: The crop production is 183 kg/ha/d but the water unlimited crop production is 201 kg/ha/d. This implies a production gap of 18 kg/ha/d or 10%. If this is on purpose, then the impact of deficit irrigation can be evaluated positively. If this happened coincidently, signals will be given that crops suffer from a water shortage that will affect economic return.
Crop Type and Area
Per-field crop type classification (wheat, rice, cotton, etc.) from visible and near-Infrared time-series. Includes vector area in hectares.
Sum area (ha) per crop type within a Group or AOI to get crop-type distribution. Count number of fields per type. No temporal rollup - single classification per season (or updated at start of season).
Similar to Water Productivity: Which crop types or areas should be optimized next season based on water performance?
Crop Water Stress
Transpiration deficit (mm/day) is the difference between potential and actual transpiration; it helps with allocating water to areas of stress that need it the most.
Area-weighted average of daily transpiration deficit (mm/day) across fields. A Group/ AOI average above zero indicates systematic under-irrigation. No "aggregation" across time. UX will show the latest value for the given time period. E.g. for weekly, the value would correspond to the 7th day value.
Crop Yield
Field-level crop yield estimate at or near harvest (t/ha) derived from Dry Matter Production + harvest index.
It's a seasonal metric - one estimate per field near harvest - calculated as an area-weighted average yield (kg/ha) across fields in a Group or AOI but for total production, sum field-level tonnes (yield × area).
It's a seasonal metric - one estimate per field near harvest - calculated as an area-weighted average yield (kg/ha) across fields in a Group or AOI but for total production, sum field-level tonnes (yield × area).
It is also useful for reviewing outcomes as it connects water use with yield and land productivity, creating understanding as to whether water delivery translated into agricultural value.
Dry Matter Production Cumulative (kg/ha)
Accumulated value of the dry matter production or in short crop production. The starting moment coupled to the start of an order.
It's the satellite-derived above-ground biomass production (kg/ha) which is calculated as an area-weighted sum of seasonal Dry Matter Production (kg/ha × ha = kg) across fields in a Group or AOI. For benchmarking, report per-hectare average (kg/ha). Single seasonal value per field; no temporal rollup within season.
Dry matter production cumulative is the major input into crop yield estimates. The variability of crop yield is directly related to the variability of crop production cumulative. IrriWatch clients can convert the dry matter production using harvest indices, root/shoot partitioning and moisture content. The cumulative crop production allows the farmer to see variability within field as well as comparing different fields/ varieties or practices impact of crop production.
Example: The dry matter production cumulative is 13,201 kg/ha for the entire season of 159 days. In case of a vegetable crop with a harvest index of 0.40, the dry yield will be 5280.4 kg/ha which at a moisture content of 90% will be 52.8 ton/ha fresh fruits.
Leaf Nitrogen (%)
This is the percentage of the accumulated dry matter production that is composed of Nitrogen (N). It relates to the above ground biomass, and usually to the leaves that are most exposed to the satellite measurements.
Water and nutrients are two essential inputs for a favourable crop production. N is usually provided at the start of the growing season, and farmers need to monitor that sufficient Nitrogen remains available in the crop to reach the end of season. Good irrigation water management is only effective if leaf N is sufficiently present.
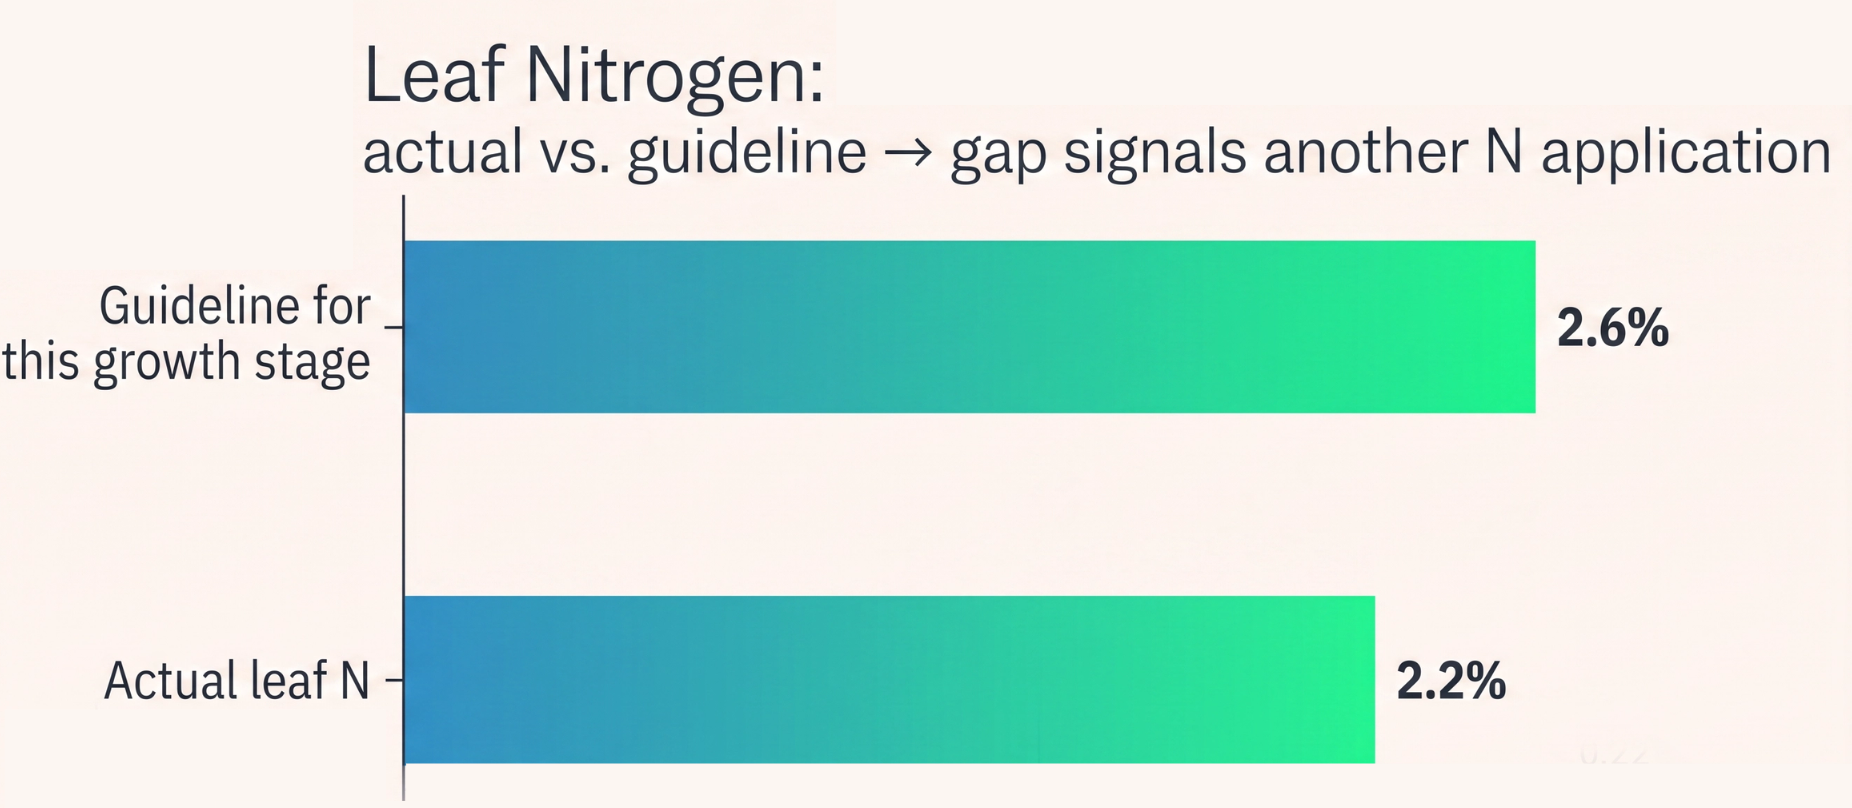
Example: The leaf N is 2.2 % and the guideline for this time of season is 2.6 % therefore that is a signal that another round of N application might be needed.
NDVI (Normalized Difference Vegetation Index)
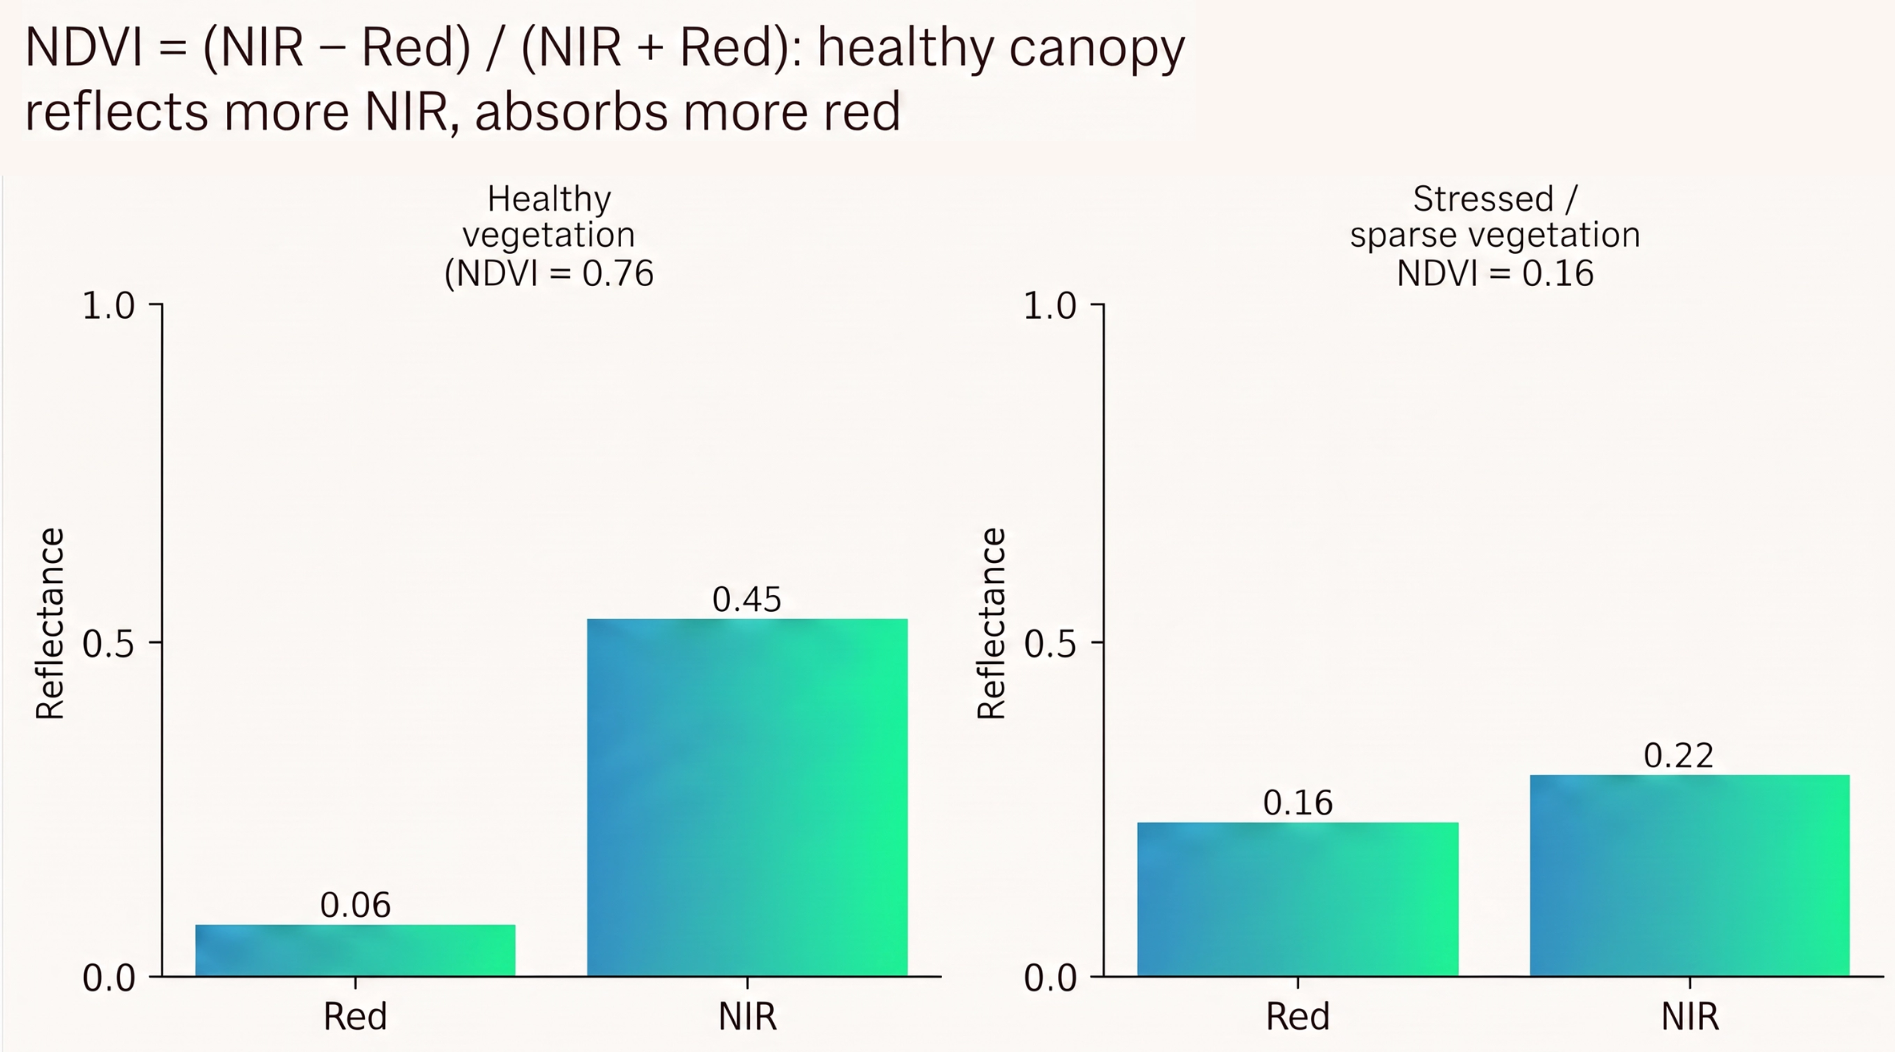
NDVI = (NIR - R) / (NIR + R) a calculation involving the red band and near infrared band
It is an indicator that gives an idea about the vegetation density and health within the field. At pixel level it shows variability or uniformity of vegetation.
Net carbon supply in soil (kg C/ha/d)
Above and below ground crop residues undergo a humification process in the soil and turns them into soil organic matter. This is a gross supply of organic matter (together with some organic fertilizers). Part of it is decomposed and returns back gaseous into the atmosphere. The difference presents the net carbon supply in soil.
Maintenance of soil organic content and the bio-organisms in it are essential for soil water holding capacity and for keeping up all nutrients required for healthy crops. At the same time, sequestration of atmospheric carbon in soil is considered useful for regenerative farming. This is basic information for carbon pools.
Example: A soil type has 1.4 % soil organic matter and it needs to be topped-up to 2.0%. If a certain cropping calendar creates an increment of 0.1%/yr, it will take 6 years to reach the target. Cover crops can accelerate this process with an extra boost.
Production Gap Cumulative (kg/ha)
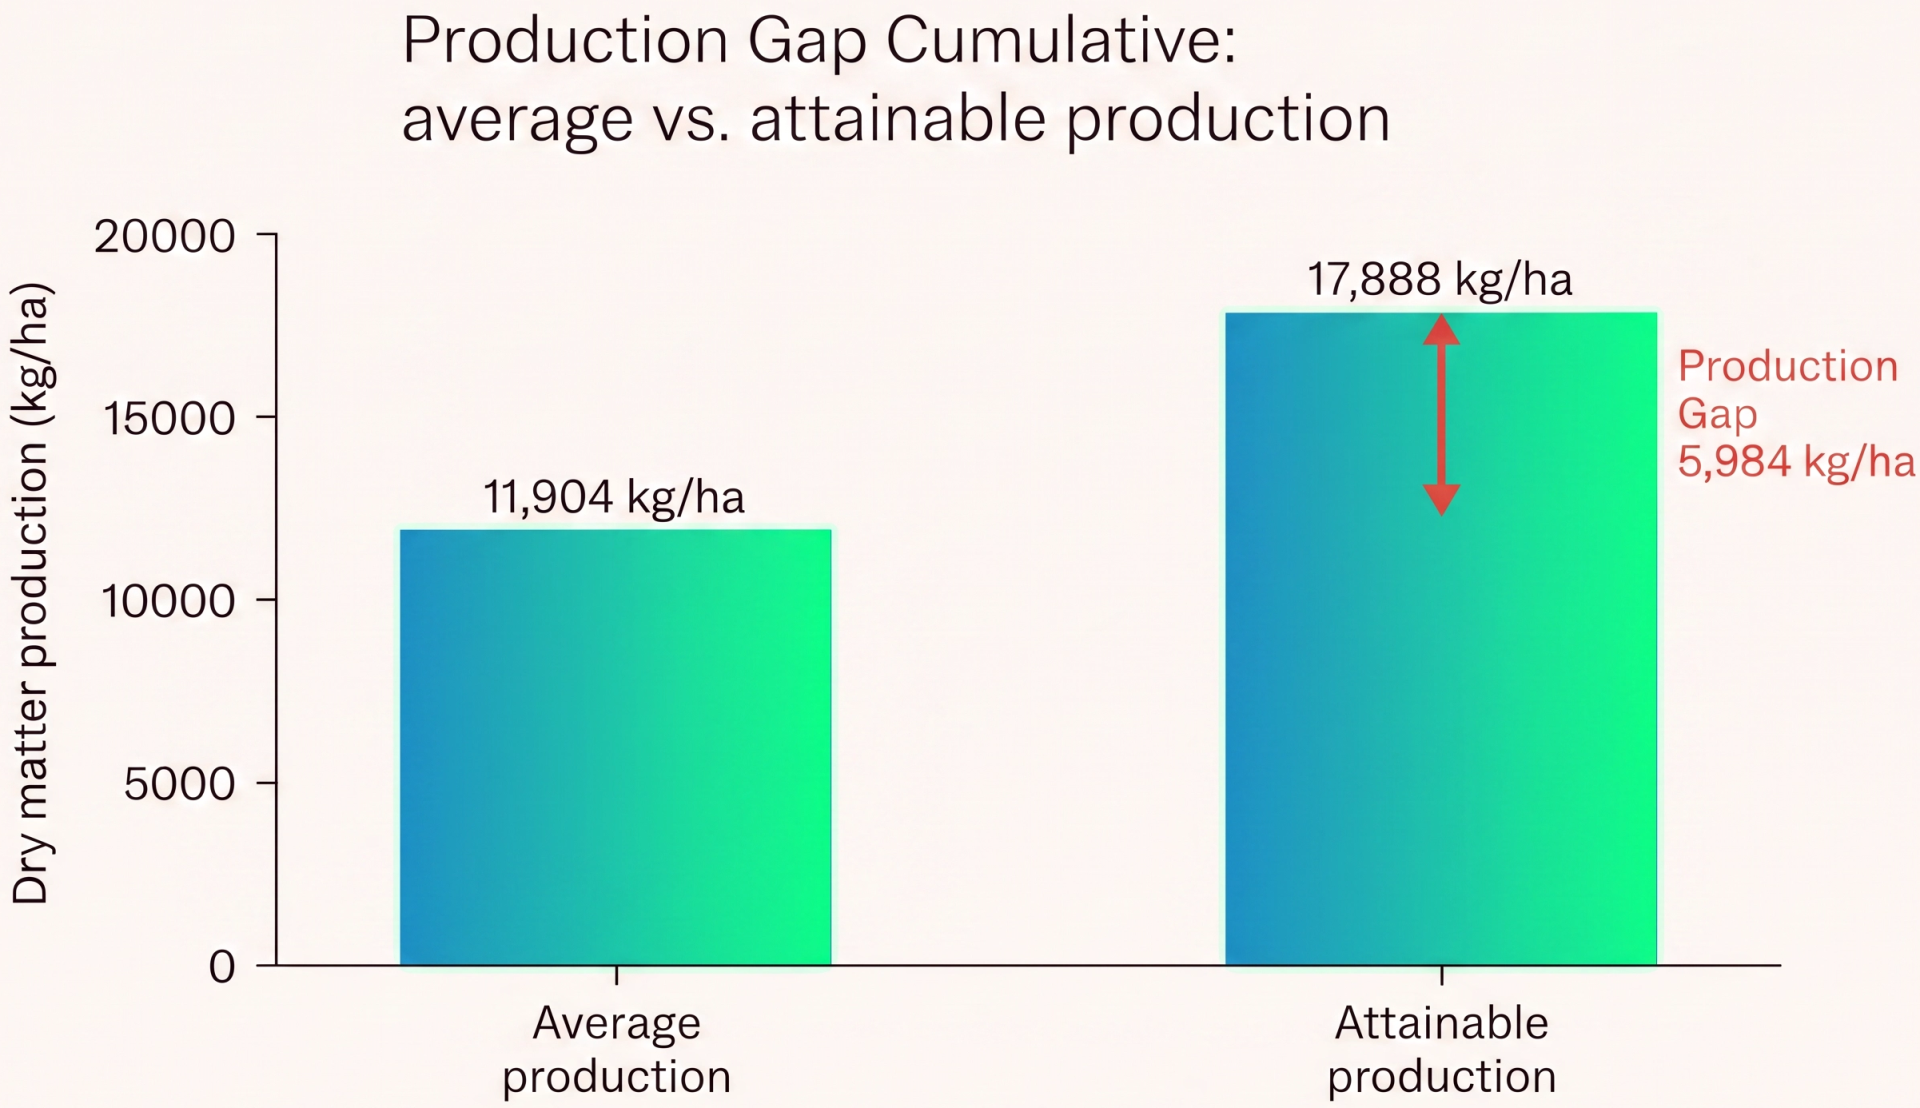
The production gap cumulative describes the difference between the average and attainable dry matter production within the same field and for the entire growing season.
Simply, the gap describes the loss of crop production due to non-uniform practices therefore, the highest crop production is reached if local spots with stunted crop production are absent so that the difference between average and attainable production can be as small as possible.
Simply, the gap describes the loss of crop production due to non-uniform practices therefore, the highest crop production is reached if local spots with stunted crop production are absent so that the difference between average and attainable production can be as small as possible.
Example: The average dry matter production cumulative is 11,904 kg/ha but the attainable production is 17,888 kg/ha. This implies a very large gap that require immediate agronomic attention and supervision to reduce it.
Soil Organic Matter Change Cumulative (mg/kg)
This is the change of organic matter content in soil following certain cropping processes and net carbon supply in soil.
The delta organic matter content shows whether soil fertility is going up or down in a given period such as a cropping season or annual cycle. It shows the farmer whether his soils are sustainable, especially as this parameter is strongly coupled to net carbon supply.
The delta organic matter content shows whether soil fertility is going up or down in a given period such as a cropping season or annual cycle. It shows the farmer whether his soils are sustainable, especially as this parameter is strongly coupled to net carbon supply.
Example: An onion field in a hot summer had low yield and much of the soil organic matter was decomposed due to high prevailing temperatures. The relatively low crop residue will not compensate the high decomposition. At a delta organic matter content of -0.4 %, the amount of organic fertilizers to be applied can be assessed.
Soil Temperature
This is the daily 24 hour average soil temperature at 10 cm depth.
It's a key indicator of soil health which plays a vital role in seed germination, root growth, and tuber production. It also influences the decomposition of carbon and other soil nutrients. Additionally, soil temperature is essential for determining optimal sowing times.
It's a key indicator of soil health which plays a vital role in seed germination, root growth, and tuber production. It also influences the decomposition of carbon and other soil nutrients. Additionally, soil temperature is essential for determining optimal sowing times.
Example: If a farmer plans to plant sugar beets but the soil temperature is 5.4°C, it would be advisable to delay planting until the temperature reaches 8°C.
Total Crop Growth
This is the accumulation of crop growth or dry matter production from date of planting.
Vegetation cover
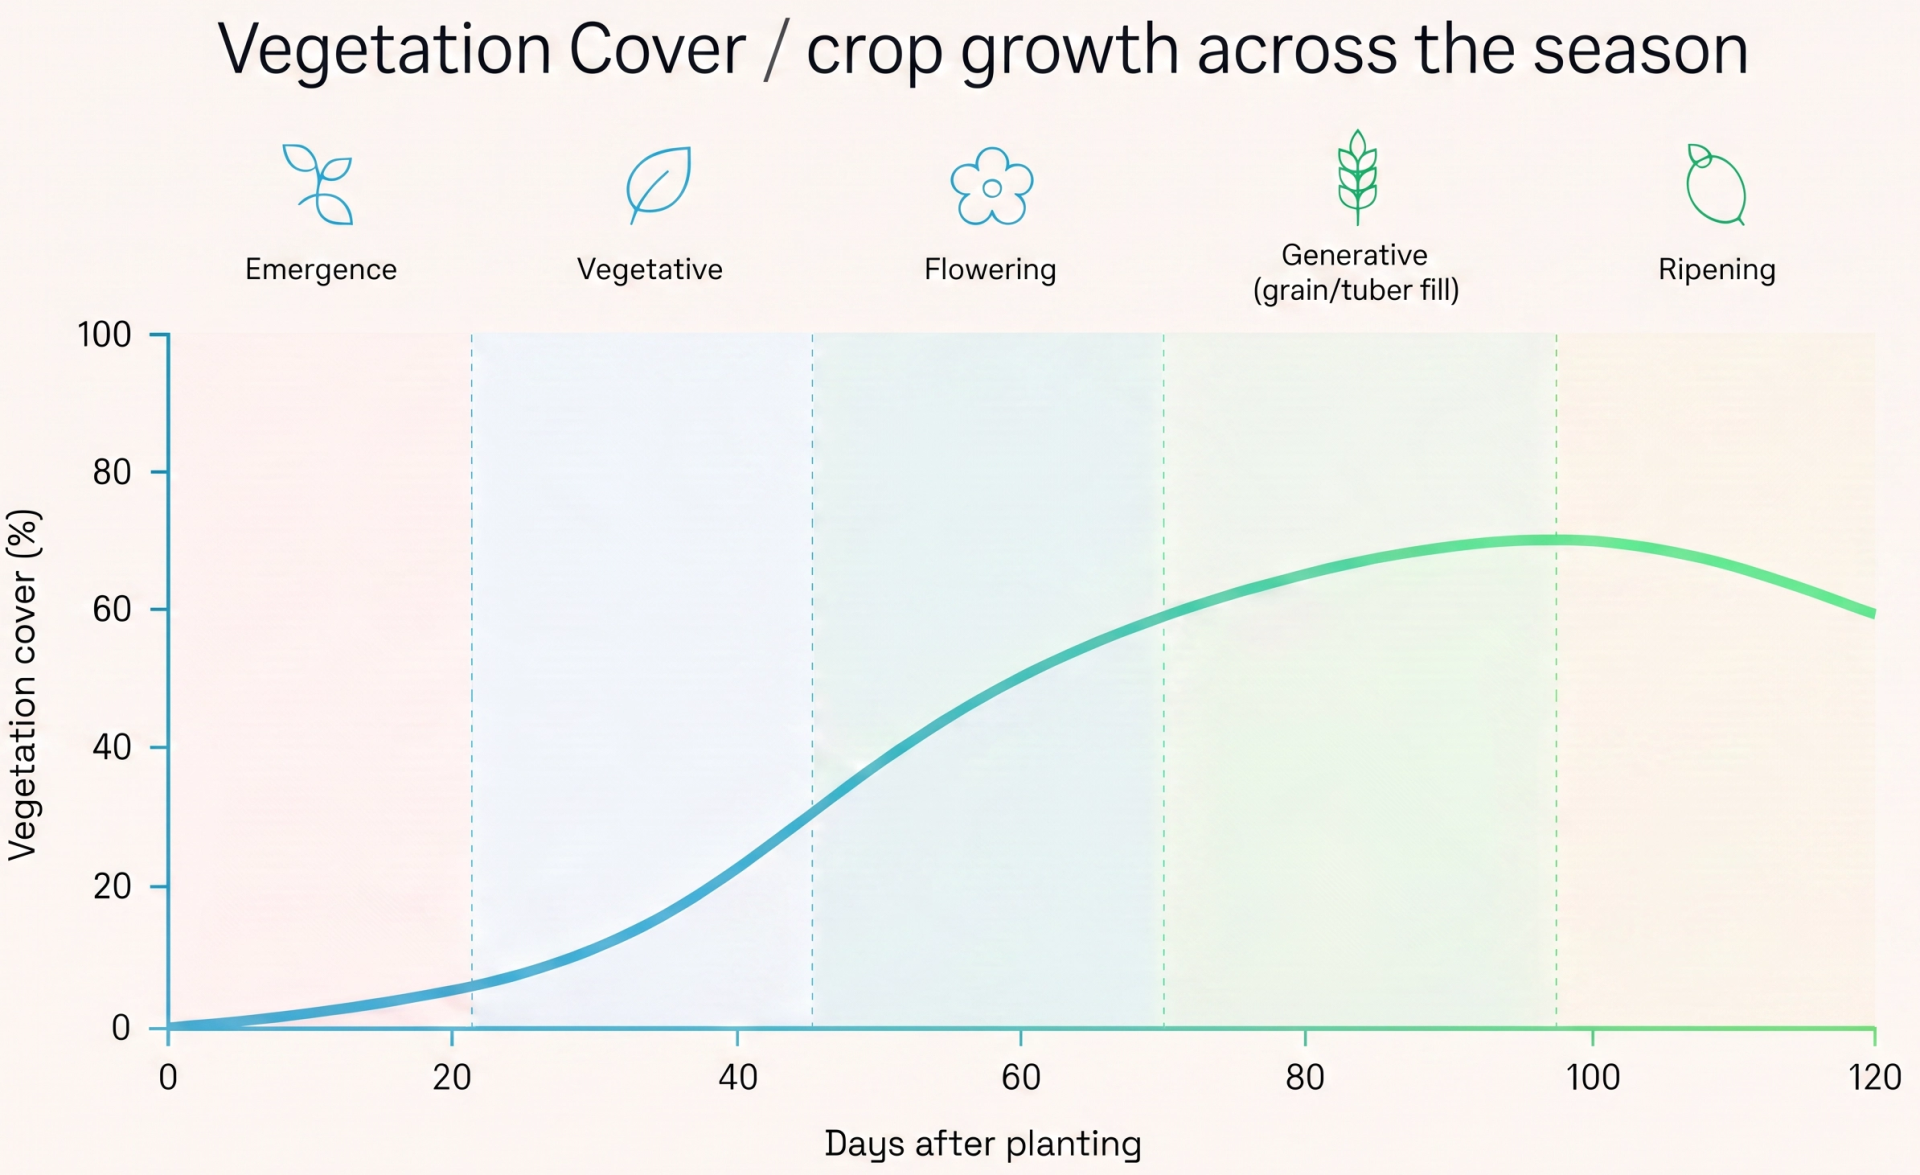
This is the fraction of biologically active green leaves covering the ground. A 100% cover means you cannot see the underground if you look through the foliage from above. Dead leaves or leaves in senescence (the biological process of aging and deterioration) are not accounted for.
Vegetation cover is a classical indicator for crop development at various stages (emergence, vegetative development, flowering, generative growth, ripening). An increasing vegetation cover implies that carbon assimilates are mainly going to stem and leaf elongations. Reduced vegetation cover increments reflect reduced photosynthesis due to range of factors (e.g. disease, fungi, insects, poor soil, low nutrient status, insufficient water). Stunted crop development can apply to the whole field (cold weather) or very locally (fungi).
Example: A maximum vegetation cover of 70% in corn at flowering stage implies that the crop will never reach full growth potential. If vegetation cover has reached maximum and a plateau, the carbon assimilates will go to grains, fruits, tubers and other harvestable crop organs.
Water Unlimited Dry Matter Production
Is the potential dry matter yield under ideal water availability, given the actual weather conditions (temperature, radiation, wind speeds etc.) that occurred... essentially what would've happened if water wasn't a limiting factor and water stress was avoided.
This metric is used to assess yield gap due to (intended) deficit irrigation.
Example: The actual crop production is 124 kg/ha/d, but if irrigation was done more timely, the crop production would have been 164 kg/ha/d. The impact of postponing irrigation is 40 kg/ha/d and this can be converted into economic damage.
Metric Table
Help us
Improve
Your feedback helps us make our Academy more useful. Tell us about your experience and what you'd like to see next.