
Irrigation Metrics Glossary
This is the glossary of a selection of important data ‘Parameters’ used in IrriWatch. The parameters are categorised into Irrigation, Crop and Climate. The descriptions include an explanation of the parameter and often a description of why it is useful as well as a possible example on how to use it.
This section covers the Irrigation Metrics.
Actual evapotranspiration (mm/d)
Total water vapor flux from land into the atmosphere depending on prevailing weather conditions, crop development and soil water potential in the root zone. Evapotranspiration (ET) comprises the Transpiration (T) through the crop, the Evaporation (E) from soil and ponding water layers as well as Interception evaporation (I) from wet leaves. Actual evapotranspiration is often indicated as ET or consumptive use.
ET is the amount of water that disappears every day in gaseous phase from the root zone and is thus the amount of irrigation water that should be applied minimally to refill the root zone back to the same soil moisture status.
Example: An ET rate of 5.2 mm/d implies that the root zone storage is reduced by 5.2 mm. To prevent reducing root zone storage, the same amount of water should be irrigated (plus some extra water to account for losses).
Actual Evapotranspiration Cumulative (mm)
This is the accumulated value of actual evapotranspiration (ET) between the first day of the order and the current day. Ideally the date of order coincides with the start of growing season.
Water management analyses require water balances, water productivities, water footprints and information on consumptive use and non-consumptive use. Actual evapotranspiration cumulative provides that information.
Example: The ET guideline of cultivating irrigated beets is max 600 mm / season. If the portal value shows 724 mm / season, then the irrigators and farm management know that they use more water than what is required, hence they could save water.
Actual Evapotranspiration Due To Applied Water (mm)
This is the accumulated value of actual evapotranspiration due to applied water (ETAW) between the first day of the order and the current day. It shows which part of the water application is used for consumptive use. Portion of Actual Evapotranspiration attributed to irrigation (Actual Evapotranspiration minus ETrain).
Area-weighted average (or sum for volume) of daily ETAW across fields. Spatial aggregation to Group or AOI uses area weighting. Temporal rollup: sum daily values to season to track cumulative consumptive use of irrigation.
Certain countries provide volumetric water entitlements on the basis of ETAW, i.e. the annual water allocation. If ETAW exceeds the allocation, penalties might be given.
Example: The ETAW water allocation of almonds in a particular groundwater basin is 720 mm/yr. If the data portal shows ETAW = 701 mm/yr, the grower knows that he is not exceeding the volume set aside for their fields.
Actual Transpiration (mm/d)
Actual sap flow through the crop. It is the T component of ET. The sap flow regulates the uptake of water and nutrients, the stomatal aperture and by doing so the entire photosynthesis and carbon assimilation.
This is the most important water parameter for crop production. It shows whether water is used beneficially.
Example: An ET of 7.2 mm/d and T of 3.2 mm/d reveals that 4.0 mm/d is non-beneficial.
This occurs in waterlogged areas and areas with shallow water tables with significant soil evaporation. While the irrigation efficiency can be high, the water is not effectively utilized in such case.
Advised Water Today (mm/d)
The amount of irrigation water per unit land (mm) by considering the latest soil moisture information, expected rainfall and reference ET0, minimum irrigation rotation, soil water holding capacity and root depth among others for aiming to avoid crop water stress.
Used for planning irrigation for different fields during the next 7 days while considering actual irrigation conditions (i.e. irrigation type, canal rotation). Distinguishing between fields requiring immediate water and those that can be considered later.
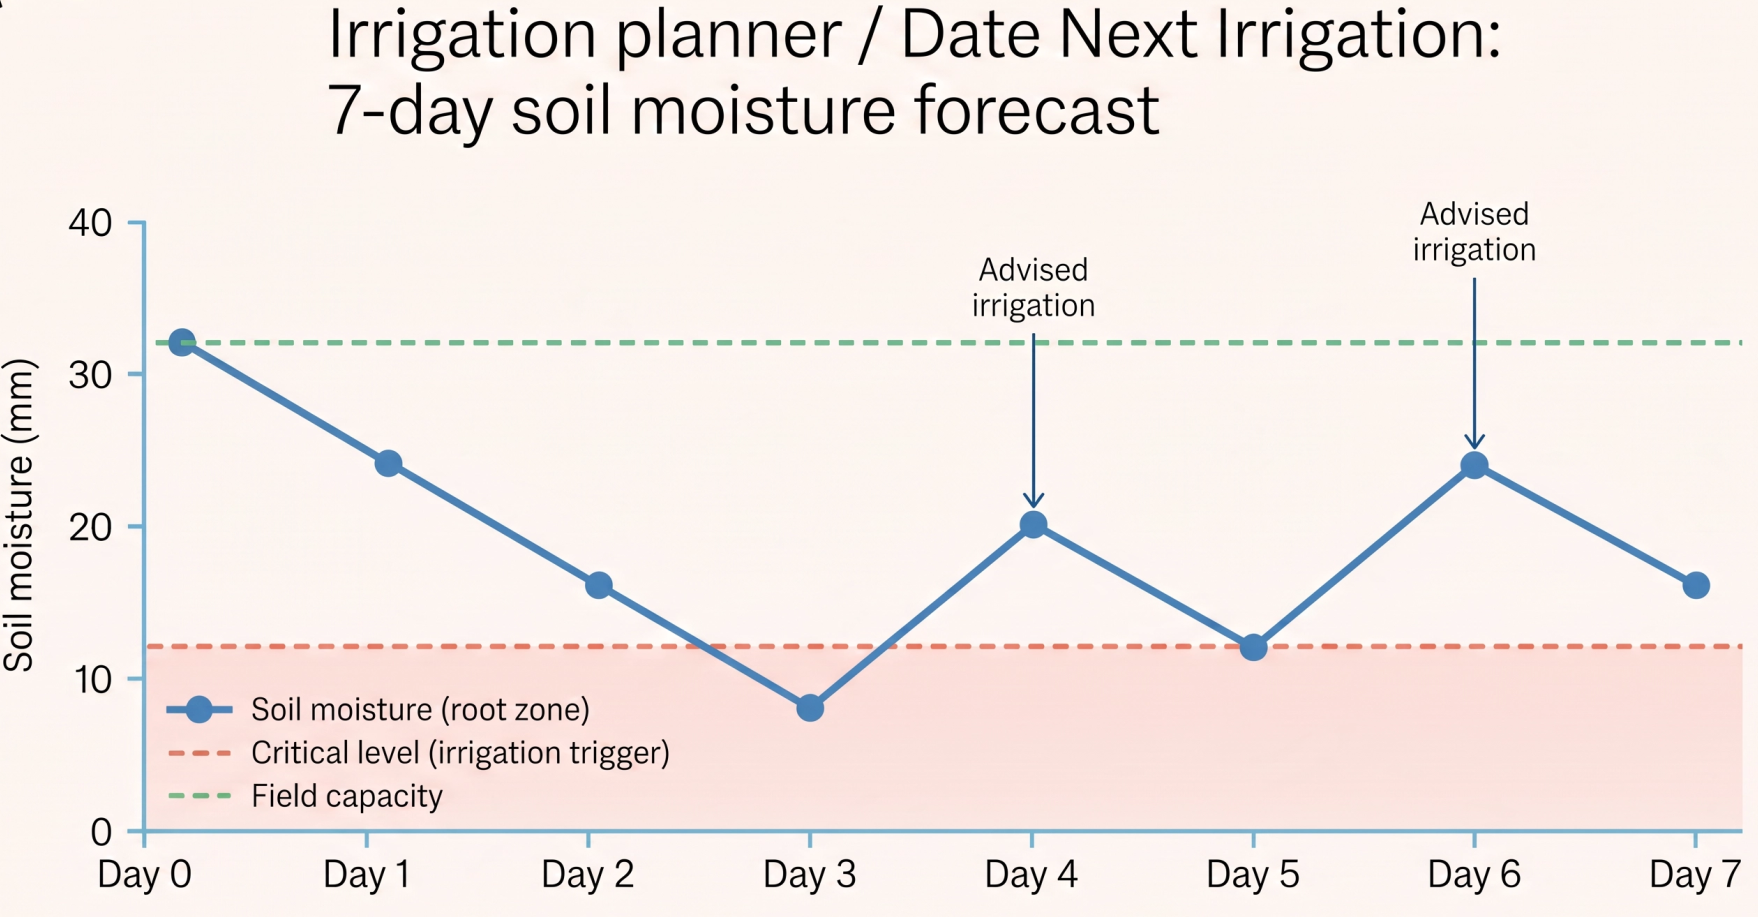
Example: For a period of 7 days, irrigation water should be provided on day 4 and 6. Other days do not require water. The amount of water is specified for every irrigation day e.g. 7.7 and 12.4 mm, which after inclusion of pipe diameter and pumping capacity can be converted by IW clients into time that the farm gate should be open or pump should be operated.
Allocation VS Consumption
Per-field comparison of consumed water (Evapotranspiration from Applied Water) against defined water allocation (% and m³).
Applied Water (Irrigation Amount or Applied Water Cumulative (mm))
Volume of irrigated water applied to a field through irrigation over any determined time frame.
Accumulation of water applied at the farm gate or taken from a tubewell across a longer period of time. Derived from TIR inversion.
Accumulation of water applied at the farm gate or taken from a tubewell across a longer period of time. Derived from TIR inversion.
Evaluation of water usage in terms of Applied Water and Consumed Water as a basis for water conservation programs, irrigation scheduling, and irrigation performance analysis. Understanding the difference between Applied Water and Consumed Water across a longer period of time to realize field losses. Information on Applied Water can be used to assess water withdrawn from source.
Sum of applied water volumes (m³) across fields in a Group or AOI per reporting period (3–5 days / weekly / seasonal). Field-level AW (mm) converted to volume using field area before summing. Temporal rollup: sum daily values to season to track cumulative consumptive use of irrigation.
What is the total irrigation water, applied water, and consumed water by district and section?
Example: If the Applied Water during a season is 890 mm for a certain field while the Actual ET cumulative is 455 mm, it means that the farmer is applying a lot more water than the crop water requirements, a lot of water is lost by deep percolation and runoff and some potential water saving can be achieved.
Another Example: Distributary canal A supplies on average for all fields 7310 m3 /ha/season, while neighbouring distributary canal B supplies 5542 m3 /ha/season. If the general water policy is to maintain equity for farmers, canal A should get less water and canal B more water (both 6426 m3 /ha/season).
Benchmark VS Consumption
Similar to Allocation vs Consumption but using benchmarking figures (not legally bounded).
When water is being delivered, verifying whether actual delivery matches the plan is important, so being able to detect deviations means this can happen before they become crop losses or farmer complaints.
Date Next Irrigation
The Date Next Irrigation layer gives users a quick overview of recommended irrigation dates for the fields on a farm. The suggested irrigation amount can be viewed in the Data & Insights tab within the panel for the next advised irrigation, offering users a rapid overview of areas in need of irrigation. This feature helps managers plan their weekly irrigation schedules and make daily adjustments as needed. For mobile systems, this information can be used which fields should get the sprinklers next.
Determination of this date is depending on the current soil moisture content, forecasted weather and water demand, type of irrigation and the minimum period between consecutive irrigations being defined by a rotation schedule.
Some fields may not trigger a moisture alert but still need irrigation on the same day. This occurs because, if the weather forecast is accurate, soil moisture is expected to drop below the critical level (irrigation criteria) within the irrigation interval, unless irrigation is applied. Conversely, when a moisture alert is triggered, irrigation is always scheduled, as the soil moisture has already fallen below the critical level. The irrigation advice per field (Date Next Irrigation) is shown when the irrigation default % is met, or in other words, when at least a certain number of pixels in the field meet the irrigation criteria.
Example: If the soil reservoir is depleting every day 8 mm, and there is still 24 mm available before crop water stress is triggered, then irrigation should be supplied within 3 days. Hence, the date shows the date of today + 3 days.
Equity
Spatial variation of Actual Evapotranspiration/ Potential Evapotranspiration (or soil moisture θ) across fields within a management unit.
Computed as the spatial CV of Actual Evapotranspiration/ Potential Evapotranspiration (or θ) across all fields in a management unit at a point in time. Lower CV = higher equity.
When evaluating performance, measuring efficiency, adequacy, equity, and reliability is useful to diagnose whether the issue was delivery, sufficiency, fairness, or timing.
Evaporation
The physical process of a liquid turning into a gas, driven by energy and atmospheric conditions. In most cases, water turning into water vapour as a result of applied heat.
Evapotranspiration Deficit
This is the difference between potential evapotranspiration (ETp) - the amount of water that would be lost to the atmosphere under ideal moisture conditions - and actual evapotranspiration (ETa) - what's actually happening given real-world conditions.
A positive ET Deficit means the crop or landscape is not getting enough water to meet its full atmospheric demand - in other words, the system is water-stressed. The larger the deficit, the more severe the stress.
A positive ET Deficit means the crop or landscape is not getting enough water to meet its full atmospheric demand - in other words, the system is water-stressed. The larger the deficit, the more severe the stress.
Evapotranspiration from Applied Water VS Applied Water
Delta between applied water and consumed water; the difference between how much water you apply to a field and how much water the crop actually consumes.
Field capacity soil moisture (cm³/cm³ or VWC (%))
Maximum volume of moisture that can be retained in soil matrix against gravity forces. The soil leaks if soil moisture exceeds field capacity. It is often regarded as the moisture in the soil 1 or 2 days after an irrigation event (or saturation). In case of saline soils, moisture should be more that field capacity so that salts are leached out below the rootzone together with percolating water.
Shows the upper limit of available soil moisture for crops. Upper limit for over-irrigation. Lower limit for leaching. Maximum value of fullness root zone.
Example: The field capacity is 0.36 cm3/cm3 (or 36% volumetric soil water content) and salts need to be leached from the root zone. Irrigation should be provided such that the actual soil moisture content is >0.36 cm3/cm3, say 0.40 cm3/cm3.
Field Irrigation Efficiency
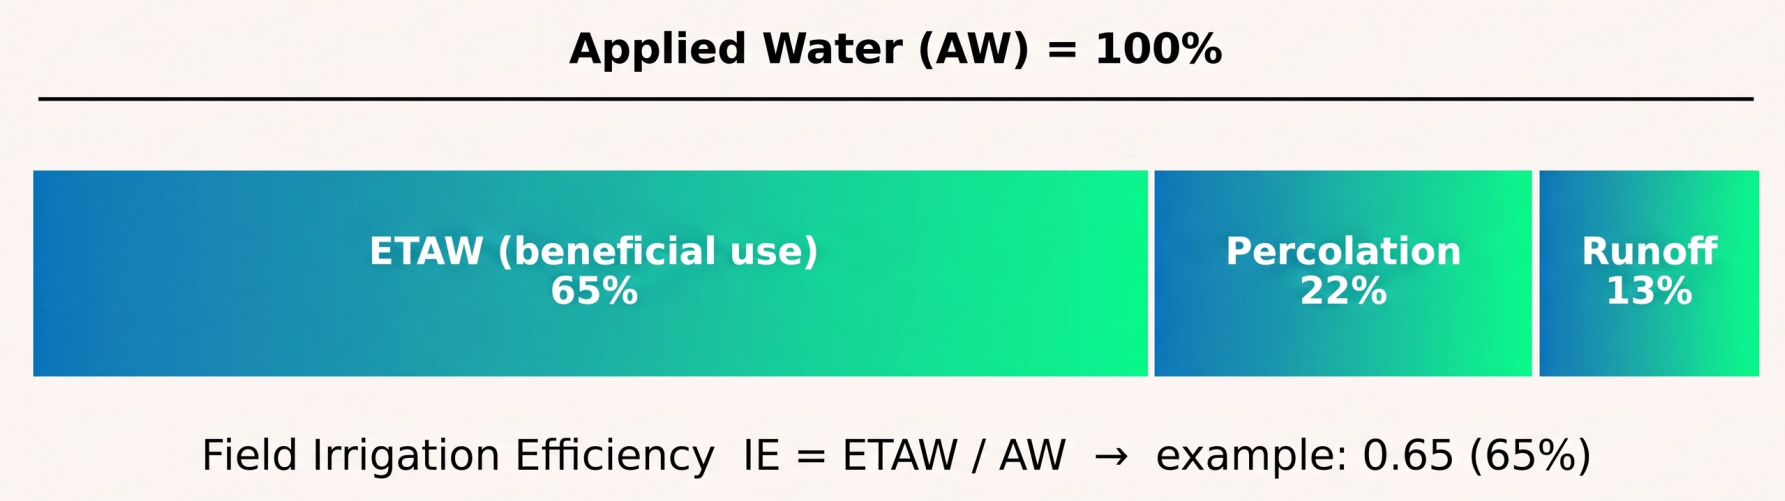
The Evapotranspiration from Applied Water (ETAW) to the Applied Water (AW) ratio. Measures productive use of applied water. Low values indicate application losses.
Per field: IE = ETAW / AW (dimensionless ratio).
For Group/AOI: area-weighted average of field-level IE ratios.
For Group/AOI: area-weighted average of field-level IE ratios.
Temporal rollup (3–5 days to weekly/seasonal): compute ratio of cumulative ETAW to cumulative AW over the period.
When evaluating performance, measuring efficiency, adequacy, equity, and reliability is useful to diagnose whether the issue was delivery, sufficiency, fairness, or timing.
Head-to-Tail Equity
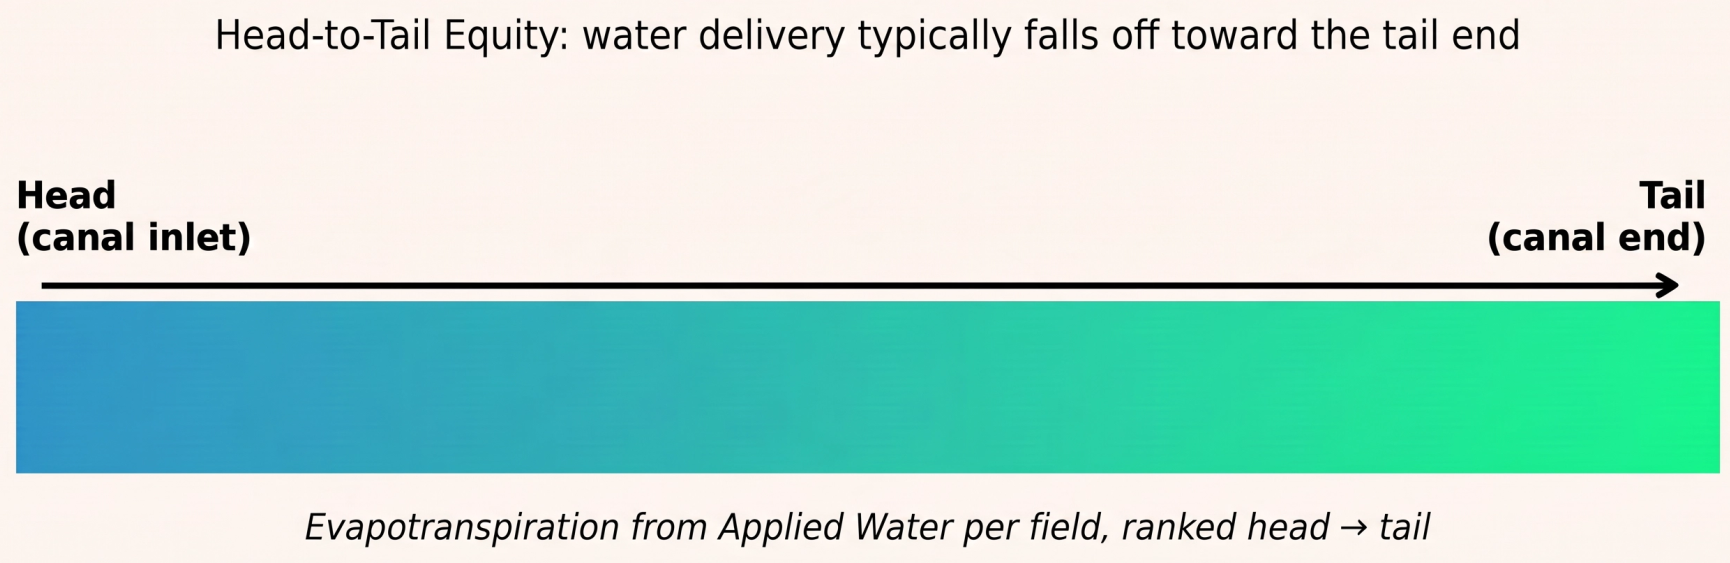
Spatial gradient of relative water delivery from head-end to tail-end of canal.
Ranked fields along canal from head to tail. Computed via an area-weighted average Evapotranspiration from Applied Water (or relative water supply) per canal sub-segment. Displayed as a gradient; no single aggregated value - spatial distribution is the output.
When tail-end fields receive less water than planned, I want to identify whether the issue is allocation, infrastructure, leakage, diversion, or upstream overuse, so that I can take the right corrective action.
Irrigated Area Extent
Binary map of irrigated vs. non-irrigated parcels per season.
Sum of irrigated field areas (ha) within a Group or AOI per season. Divide by total cultivable area to get % irrigated. No temporal aggregation - single seasonal snapshot.
Irrigation Adequacy
Spatial map of whether Actual Evapotranspiration/ Potential Evapotranspiration is within acceptable bounds per field. Identifies under-irrigated areas.
Per field: ADQ = Actual Evapotranspiration/ Potential Evapotranspiration (ratio, 0–1).
For Group/AOI: area-weighted average.
For Group/AOI: area-weighted average.
Daily metric; temporal summary can show % of days with adequate supply over a period.
When evaluating performance, measuring efficiency, adequacy, equity, and reliability is useful to diagnose whether the issue was delivery, sufficiency, fairness, or timing.
Irrigation Intensity
Number of irrigation events or growing seasons per year per field.
Average number of irrigation events or seasons per year, averaged across fields in a Group or AOI (simple average, not area-weighted). Annual metric with no within-season temporal rollup.
Irrigation planner
An 7-day irrigation planner is available in the graph selection. It shows the current soil moisture of a field and the expected rainfall for the next 7 days. Using this information alongside the advised water for each day is advised. The minimum irrigation days can be adjusted so it fits different irrigation schedules.
The irrigation planner helps you with the planning of operations for a week related to irrigation services.
Irrigation Reliability
Temporal variation of Actual Evapotranspiration/ Potential Evapotranspiration (or soil moisture θ) over the season. High variation = unreliable supply.
Computed using temporal CV of Actual Evapotranspiration/ Potential Evapotranspiration (or soil moisture θ) at field level over the season. For Group/AOI: area-weighted average of field-level temporal CVs.
When evaluating performance, measuring efficiency, adequacy, equity, and reliability is useful to diagnose whether the issue was delivery, sufficiency, fairness, or timing.
Irrigation Uniformity
Coefficient of variation of Evapotranspiration from Applied Water within a field or canal section. Low uniformity = poor distribution.
Similar to equity but at field level: Was there inequity between upstream and downstream?
Computed as the coefficient of variation (CV = standard deviation / mean) of Evapotranspiration from Applied Water across fields within a Group or Canal section for the reporting period. Lower CV = more uniform distribution.
Moisture Status
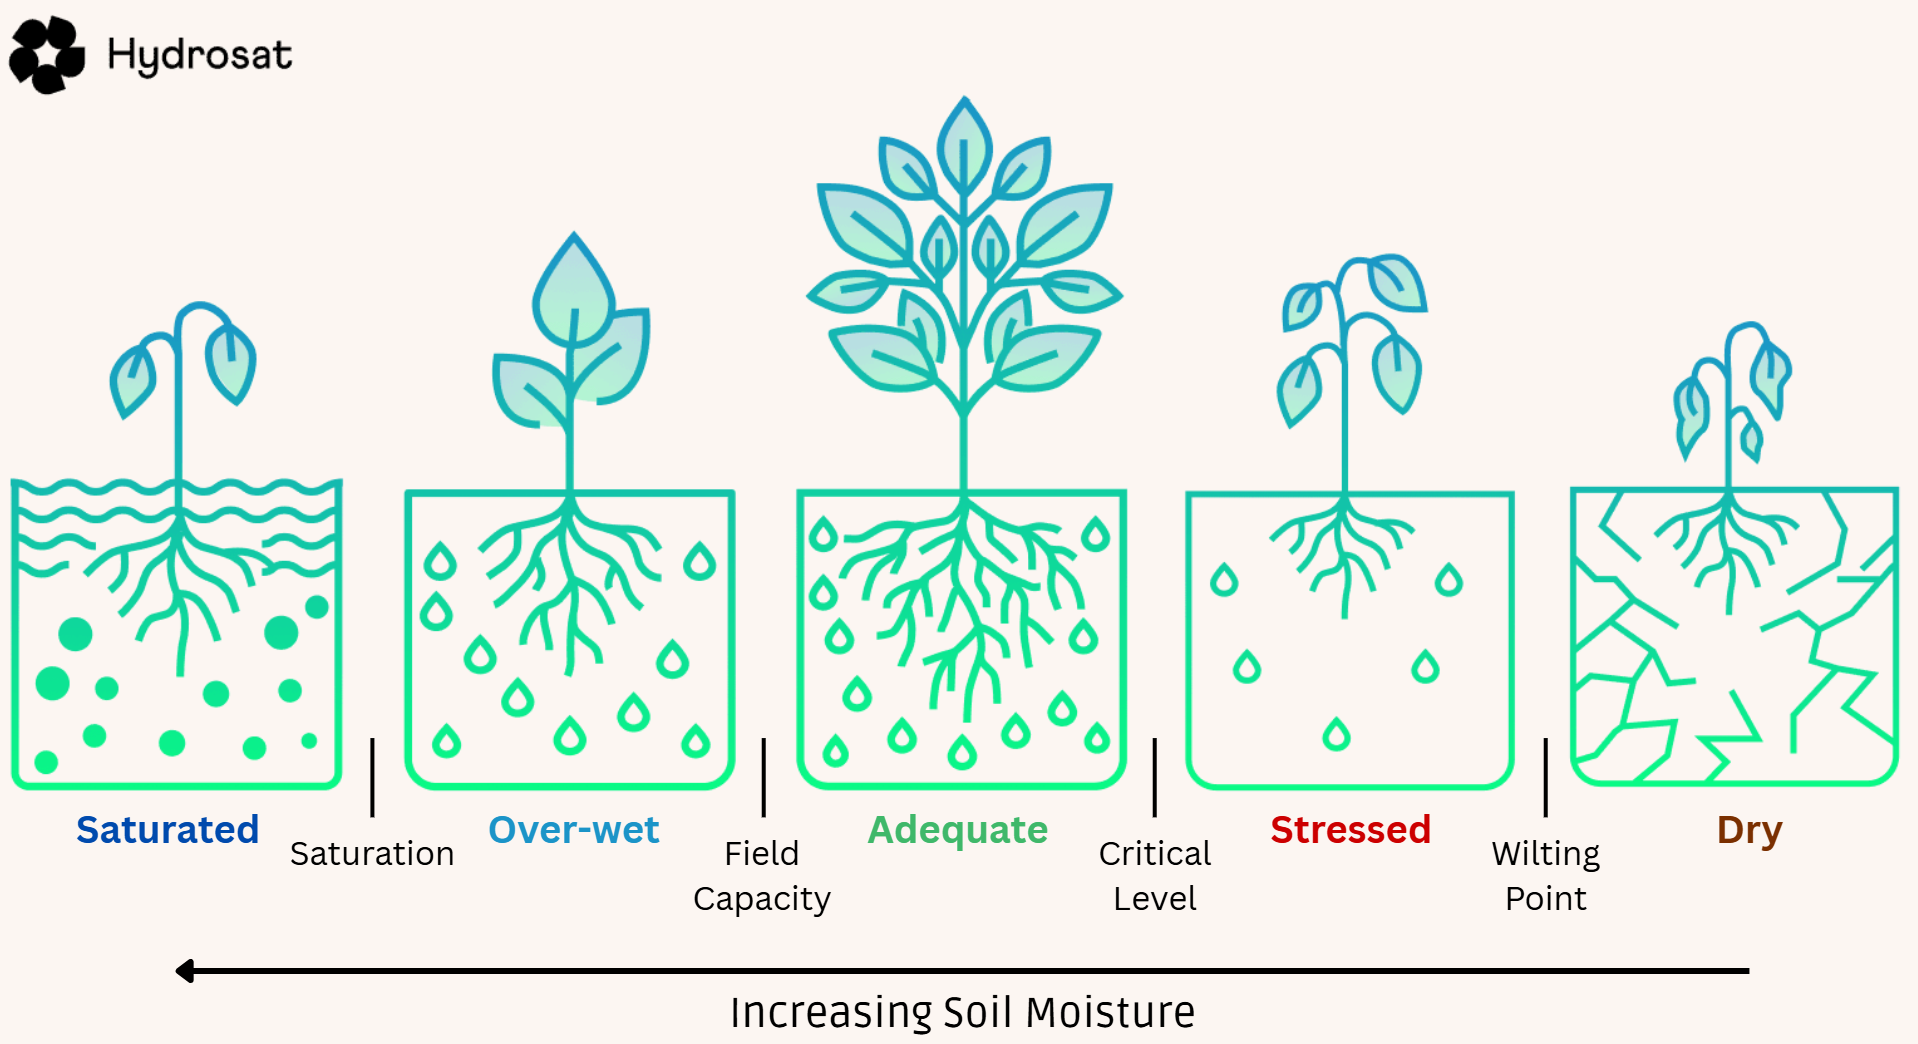
Upon opening, the Moisture status layer is activated by default, giving users a quick overview of the field conditions: the moisture status of crops and their ability to uptake water and nutrients.
It provides information on whether actual soil moisture is in an acceptable range, so not too dry and not too wet. The moisture status is based on the soil moisture map, but gives a rapid overview on fields and part of fields being in an unfavourable condition.
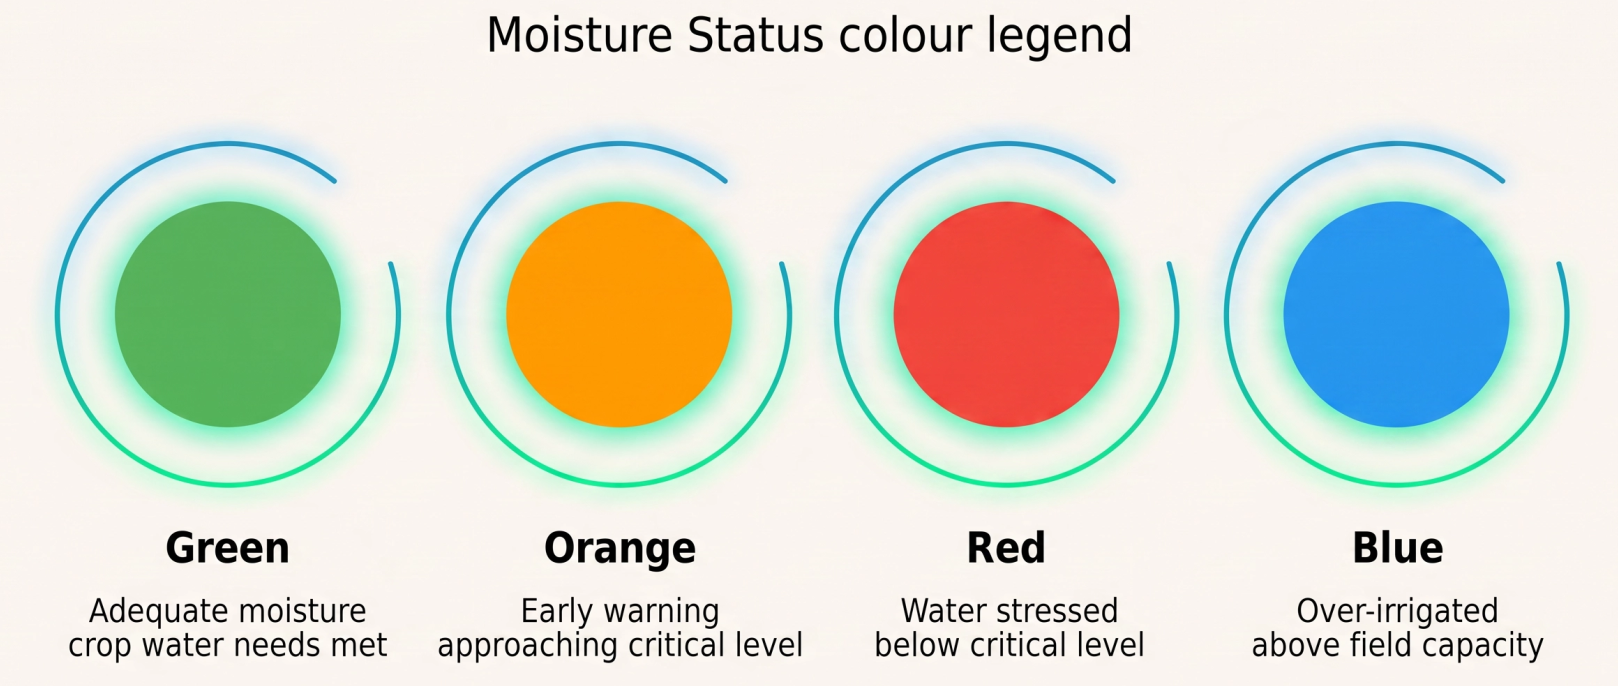
If users irrigate on time and keep the soil moisture in the root zone between field capacity and the irrigation criteria, the field remains green (indicating adequate moisture). Green suggests that soil moisture status is adequate for crop production. The crop water requirements are satisfied from the soil profile.
The colour turns orange as early warning to prevent water stress, which occurs when soil moisture falls between the irrigation criteria and critical soil moisture. Orange suggests that soil moisture is stressed and that crop production might be impacted, but it is not very prominent.
After irrigation is delayed, the pixels turn red; in this case, soil moisture is equal to or less than the critical soil moisture. Red suggests that soil moisture is dry and that crop production is adversely impacted because photosynthesis is hampered by water shortage.
If irrigation exceeds crop water requirements and over-irrigation occurs above field capacity, the field turns blue. Blue suggests that soil moisture is over-wetted due to excess irrigation or due to heavy rainfall. If the field remains blue for a duration of one week or longer, there might be a drainage related problem.
This irrigation traffic light is only activated if the vegetation cover exceeds 20%; otherwise, the pixels indicate sparse vegetation. Yellow suggests that the crop has sparse vegetation being insufficient to properly measure root zone moisture conditions.
The Moisture status layer is not based on forecasted data, so it doesn't align with the first day of the irrigation planner. Instead, it is based on the most recent data derived from the latest satellite images.
Example: If your field is mainly green with some orange spots, you are getting a signal that parts of the field are drying up faster than other parts.
Overuse
Spatial map highlighting fields/zones where Evapotranspiration from Applied Water has exceeded allocation. Colour-coded by severity.
No numeric aggregation - binary flag per field (overuse yes/no) derived from Evapotranspiration from Applied Water > allocation. At Group/AOI level, report: count and % of fields flagged, and total excess consumption (m³) above allocation.
Percolation
Deep percolation from rootzone to underground. Water balance loss term estimated from soil texture and irrigation rate.
Area-weighted average of daily percolation depth (mm) across fields. For volume, sum field-level values. Temporal rollup: sum daily to weekly/seasonal totals to quantify cumulative drainage losses.
Permanent Wilting point (cm³/cm³ or VWC (%))
Volume of moisture that is adhering strongly to the soil matrix and cannot be extracted by crops due to very strong suction. Generally speaking, the soil water potential at wilting point for most crops and soils is approximately 15 bar (pF 4.2).
Determines lower limit of available soil moisture for crops. Minimum value of fullness root zone. Also known as permanent wilting point.
Example: If field capacity is 0.178 cm3 /cm3 (100%) and wilting point 0.073 cm3 /cm3 (0%), crops have maximum 105 mm of water available (provided root depth is 100 cm). But not all this water is easily available, so it essential to keep the soil moisture far above wilting point, in this case above 0.073 cm3 /cm3. Depending on crop type this should be typically 0.10 to 0.13 cm3 /cm3.
Potential Evapotranspiration
Evapotranspiration that does not take into account the effects of a specific crop. It focuses on a hypothetical surface with uniform vegetation cover and an unlimited access to a water supply. It is ambiguous for irrigation purposes but widely used in areas such as hydrology or meteorology.
Potential Transpiration
The maximum rate of water loss from a crop through transpiration that could occur under ideal conditions. It focuses on a hypothetical surface with uniform vegetation cover and an unlimited access to a water supply. It is ambiguous for irrigation purposes but widely used in areas such as hydrology or meteorology.
Precipitation Cumulative (mm)
Actual gross rainfall amount from the global weather model.
If a client connects their own rain gauge to IrriWatch, this will show the accumulated rainfall data from their weather station. Where this is not applicable, we use local rainfall products in IrriWatch (e.g. NWS for USA; KNMI for the Netherlands, etc.)
Postponement of irrigation turns and understanding why soils are not irrigated or are very wet due to a rainstorm. Input into the field scale water balance.
Example: Rainfall increased by 23mm in couple of days. This implies that rainfall was sufficient for meeting crop water requirements.
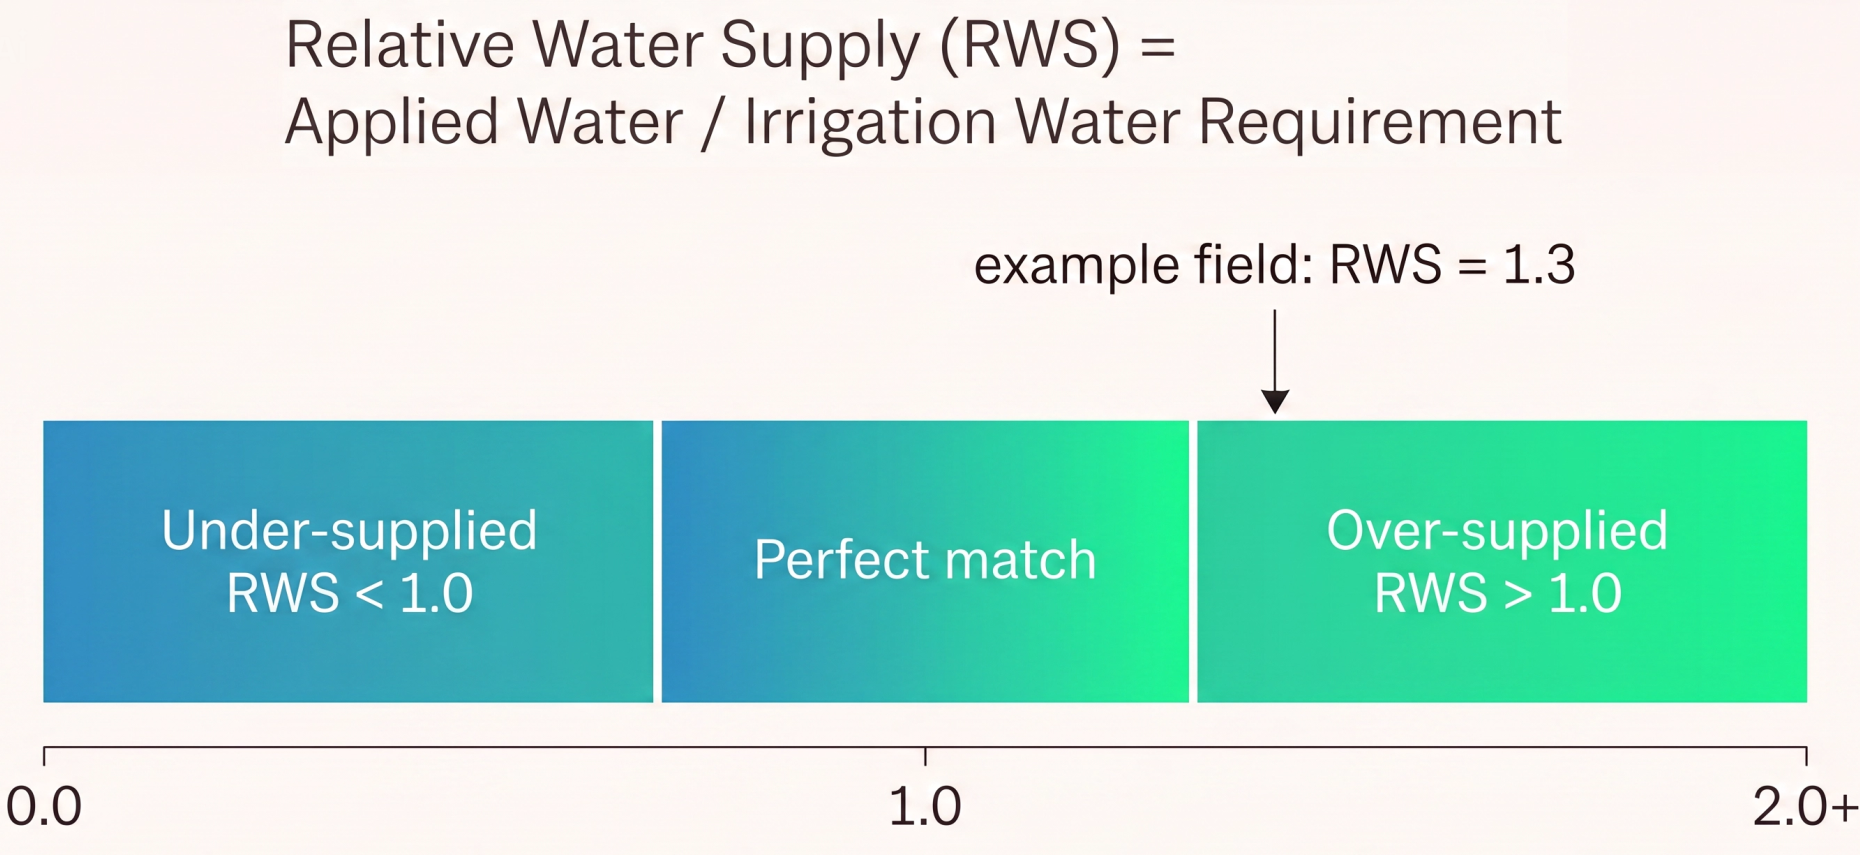
Relative Water Supply
Applied Water/ IWR ratio where >1.0 = over-supplied; <1.0 = under-supplied; 1.0 = perfect match.
Per field: RWS = AW / IWR.
For Group/AOI: area-weighted average of field RWS values.
For Group/AOI: area-weighted average of field RWS values.
Temporal rollup: use cumulative AW and cumulative IWR over the period. Values >1 = over-supply; <1 = under-supply.
When presented with under-irrigation or over-irrigation, it's crucial to locate where it is happening, so that intervention can occur at the right section rather than react broadly across the whole scheme.
Root Cause Analysis
For water productivity gaps, shows reason codes such as “water deficit” or “excess water”.
When tail-end fields receive less water than planned, it's important to identify whether the issue is allocation, infrastructure, leakage, diversion, or upstream overuse, so that the right corrective action can be taken.
Runoff
Surface runoff estimated from soil type, topography, and rainfall intensity. It's a water balance loss term presented as a temporal rollup: sum over the period.
Area-weighted average of runoff depth (mm) per period across fields in a Group or AOI. For total volume, sum field-level volumes (mm × area).
When tail-end fields receive less water than planned, it's important to identify whether the issue is allocation, infrastructure, leakage, diversion, or upstream overuse, so that the right corrective action can be taken.
Saturated Soil Moisture (cm³/cm³ or VWC (%))
Maximum volume of moisture in the soil that cannot be exceeded. All pores are filled with water and air is driven out.
Pinpoints over-irrigation or heavy rainfall; assessment of drainage capacity and drainage problems if the actual soil moisture in the rootzone is close to saturation for several days.
Example: If soil moisture content at saturation is 0.48 cm3/cm3, and the actual soil moisture is 0.45 cm3/cm3, oxygen deficit may occur and hamper crop production (except for rice).
Scheme Benchmarking Ranking
Sortable table and choropleth map ranking all schemes or districts by any selected performance indicator.
For each performance indicator, compute the Group/AOI-level aggregated value (using the metric-specific logic defined above), then rank all schemes. No additional aggregation - ranking is applied to already-aggregated indicator values.
When comparing schemes, sections, or seasons, it's useful to see benchmarks, hotspots, and variability, so that focus or attention can be on the biggest performance gaps rather than isolated metrics.
Soil Moisture Critical Root Zone (cm³/cm³ or VWC (%))
The soil moisture critical is the level of soil moisture at which the plants starts to stress. It represents the soil water potential at which the crop starts to close the stomates because at the critical level, water uptake by root get delayed.
This critical level of soil moisture is variable depending on the climate and leaves temperature, it is rather a dynamic curve allowing the grower to avoid any moisture stress. The soil moisture should always be above the critical soil moisture level.
Soil Moisture Holding Capacity (mm)
Soil Moisture Holding Capacity is the amount of water that a given soil can hold for crop use. It is the amount of water held between field capacity and permanent wilting point. Soil texture and organic matter are the key components that determine soil moisture holding capacity. In terms of soil texture, those made up of smaller particle sizes, such as in the case of silt and clay, have larger surface area. The larger the surface area the easier it is for the soil to hold onto water so it has a higher water holding capacity. Sand in contrast has large particle sizes which results in smaller surface area. The water holding capacity for sand is low.
The soil moisture holding capacity is important for farmers to manage irrigation as it gives an idea about the maximum amount of water stored in the soil. Adding more water will be lost due to percolation or run-off.
Soil moisture root zone (cm³/cm³) or Percent Volumetric Water Content (VWC in %))
Volume of the soil voids being filled with water. It is the volume of water per volume of soil, also known as a Volumetric Water Content (VWC). The soil system is a mixture of minerals and pores. Pores can be air-filled or water-filled. Moisture of the root zone relates to the range of the sub-surface where uptake of water by roots takes place. Layers with a higher density of roots will abstract more water. The soil moisture of the root zone presents a single depth-integrated value. The actual soil moisture value provides information on the minimum and maximum amount of irrigation to be applied for keeping the soil in the easily available moisture range where crop water stress is avoided.
This is used for expressing wetness of the soil, the need to irrigate and the maximum amount of water that can be added to the soil before leaking sets on. In a spatial context, soil moisture reflects local processes such as ponding water surfaces, higher soil permeability, shallow roots, higher crop evapotranspiration etc.
Example: A soil moisture of 0.216 cm3 /cm3 is equal to a volumetric soil water content of 21.6%. While such value is normal for clay soils, it is high for sandy soils. If the soil water content at field capacity is lower e.g. 0.198 cm3 /cm3, this soil is over-wetted. So actual moisture values should always be evaluated in the context of permanent wilting point, field capacity and the critical level where crops reduce their photosynthesis.
Soil water potential field capacity root zone
Field capacity is the amount of water soil can hold after gravity has drained the excess away. It's not a fixed physical property so the standard way to define field capacity is by the soil water potential (suction) at which drainage effectively stops. Therefore, the soil water potential at field capacity across the root zone is the average suction when the soil is at field capacity.
In 2021 we updated orders to use -10 kPa from -23 kPa in 2020, but both are independent of the crop type. This fixed soil water potential specifies the maximum soil moisture that can be retained. This has great impact on the soil water holding capacity.
In 2021 we updated orders to use -10 kPa from -23 kPa in 2020, but both are independent of the crop type. This fixed soil water potential specifies the maximum soil moisture that can be retained. This has great impact on the soil water holding capacity.
Example: A sandy soil at -10 kPa can hold only 0.12 cm3/cm3 while a loam soil can hold at the same suction 0.26 cm3/cm3.
Soil Water Potential (cm or hPa) / Virtual tensiometer graph
Suction of the soil matrix expressed as a negative pressure head. It describes the energy at which soil moisture is bounded inside soil pores by cohesion and adhesion forces. It defines the minimum energy required by crops to withdraw water from the unsaturated soil matrix. Crops have access to soil moisture if their suction is stronger than the suction of the soil matrix. Different units for potential exist. 1 kpa = 10 hpa = 10.19 cm water column = pF 1.0 = 0.001 MPa = 0.01 bar.
It is the best soil-physical basis for assessing the need to irrigate before tomorrow evening. The soil water potential for certain crop and prevailing weather condition combinations should be less negative than the prevailing water potential in the soil matrix for an optimum uptake of water and nutrients.
Example: The depth averaged soil water potential is -421 hPa and lettuce starts closing stomates and crop water stress at -350 hPa. This is a situation that mild water stress occurs because lettuce has a hard time to pull all water out of the soil pores. The pixel will turn red to indicate that irrigation is required.
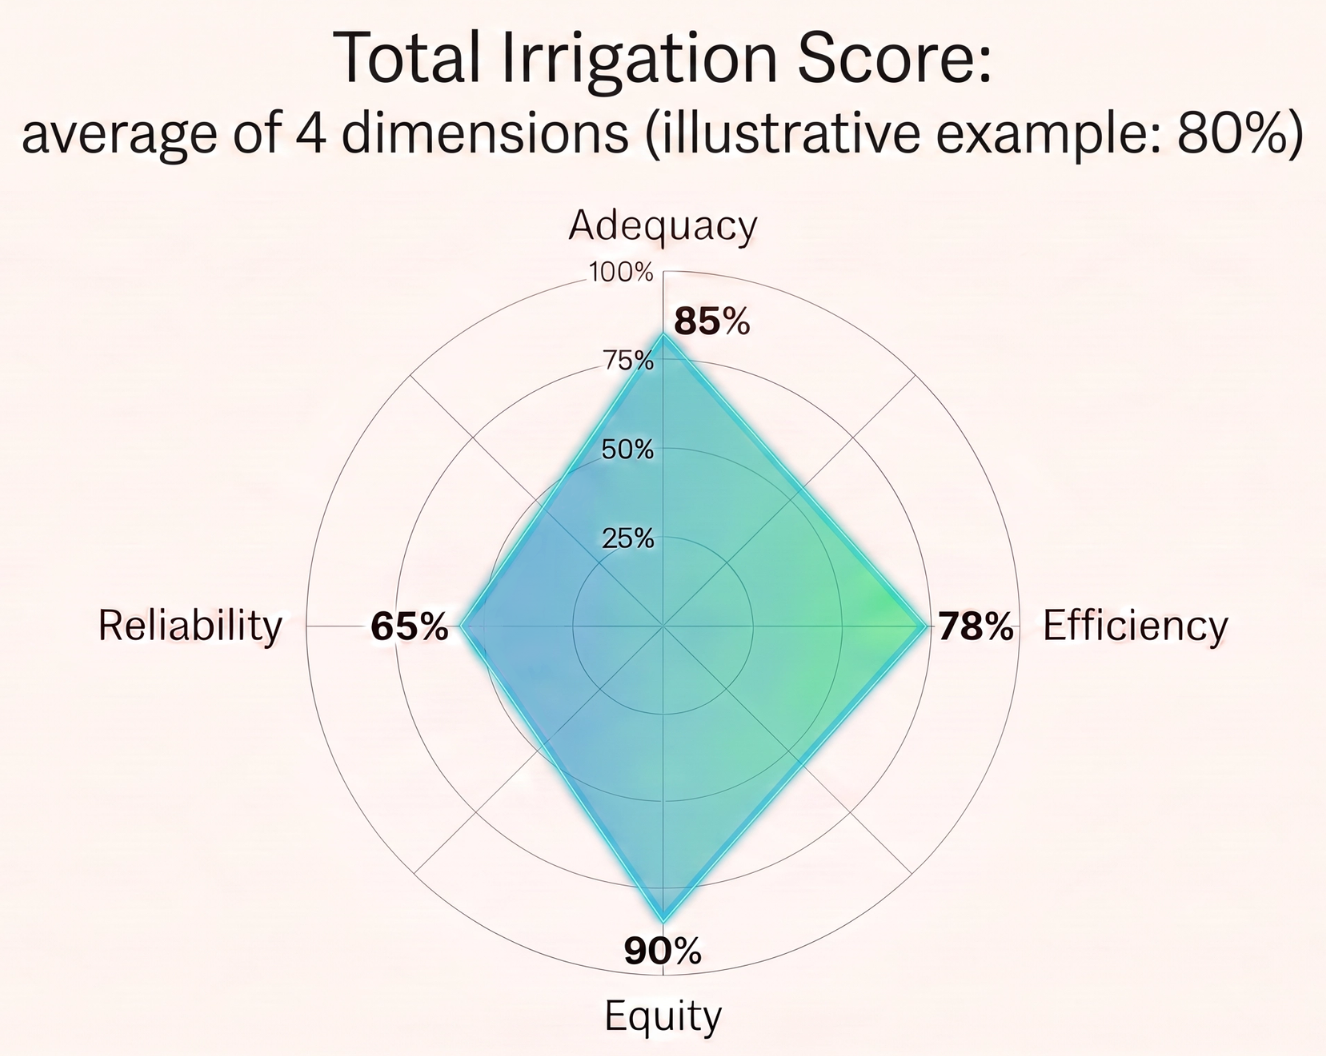
Total Irrigation Score
The average of Irrigation Efficiency, Adequacy, Reliability and Equity, expressed as %.
No specific aggregation logic needed as it will be the average of the 4 metrics at their selected spatial aggregation level.
When comparing schemes, sections, or seasons, it's useful to see benchmarks, hotspots, and variability, so that focus or attention can be on the biggest performance gaps rather than isolated metrics.
Unauthorised Withdrawal
Spatial clusters of anomalously high Applied Water relative to allocation near canal head-works.
Count and spatial cluster of flagged fields within a Canal section or Group. Flag criteria: Applied Water significantly exceeds allocation near canal head. Report: number of flagged fields, total excess Applied Water volume (m³).
Virtual soil moisture probe
A graph combining soil moisture in the rootzone with the thresholds of saturated soil moisture, field capacity, wilting point, and critical soil moisture.
This is used to measure soil moisture in the root zone in relation to desirable moisture levels; assess duration of under and over-irrigation. The moisture should be kept ideal in the green colour. It replaces a field moisture sensor.
Water Balance by Zone
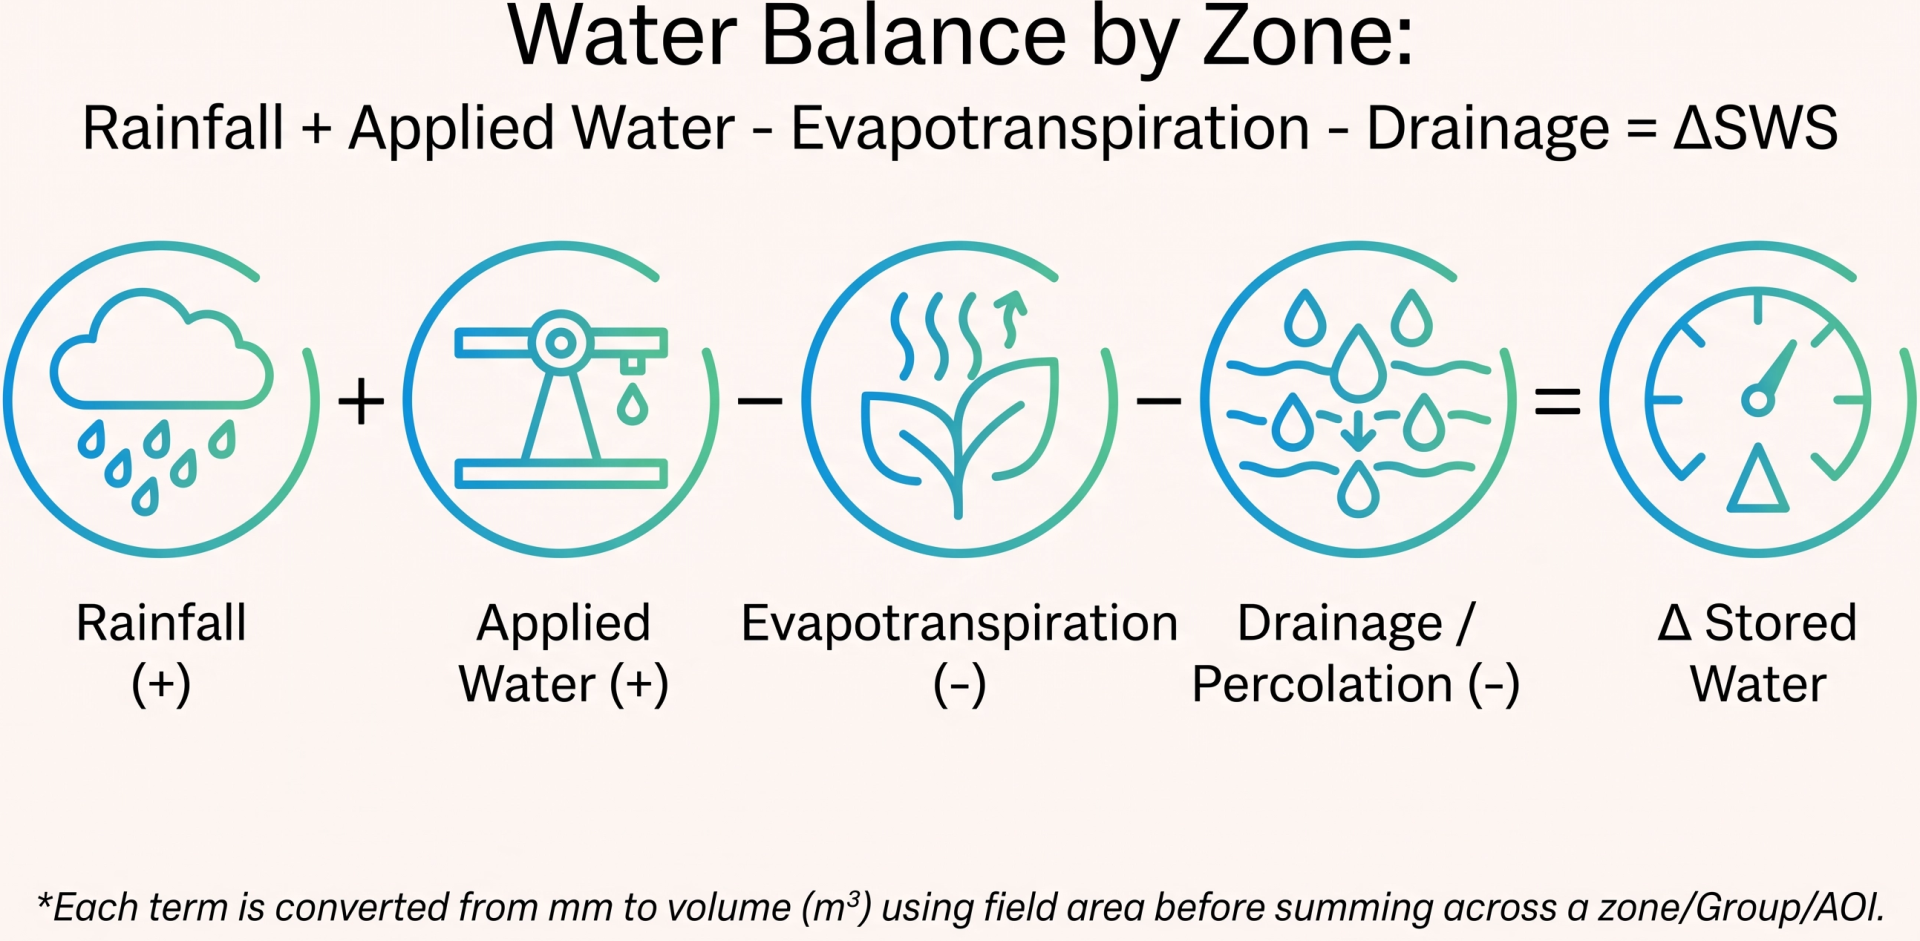
Full water balance per management unit: Rainfall + Applied Water − Evapotranspiration − Drainage = ΔSWS
Sum these components across fields in a zone/group/AOI by converting each from mm to volume (m³) using field area, then add them together. ΔSWS is the resulting change in stored water which is expressed monthly and seasonally.
Water Productivity Applied Water
Crop yield per unit of applied irrigation water (kg/m³).
It's a seasonal metric which is useful where billing is based on applied volumes. It's comparable to WPET but uses applied water instead of consumed Evapotranspiration.
It's a seasonal metric which is useful where billing is based on applied volumes. It's comparable to WPET but uses applied water instead of consumed Evapotranspiration.
Per field: WPAW = Y / seasonal Applied Water (kg/m³).
For Group/AOI: area-weighted average of field-level WPAW.
For Group/AOI: area-weighted average of field-level WPAW.
When it comes to reviewing outcomes, connecting water use with yield and land productivity is important in order to understand whether water delivery translated into agricultural value.
Water Productivity Evapotranspiration
Crop yield per unit of Evapotranspiration consumed (kg/m³).
It's a seasonal metric which is benchmarkable against FAO/IWMI global crop-specific targets.
It's a seasonal metric which is benchmarkable against FAO/IWMI global crop-specific targets.
Per field: WPET = Y (kg/m²) / seasonal Actual Evapotranspiration (m³/m²) = kg/m³.
For Group/AOI: area-weighted average of field WPET. Do not compute as group total yield / group total Evapotranspiration (different denominators distort the average).
For Group/AOI: area-weighted average of field WPET. Do not compute as group total yield / group total Evapotranspiration (different denominators distort the average).
When it comes to reviewing outcomes, connecting water use with yield and land productivity is important in order to understand whether water delivery translated into agricultural value.
Water Productivity Gap
A seasonal metric which is the difference between Water Productivity (using Evapotranspiration or Applied Water) and Water Productivity Target (for Evapotranspiration or Applied Water).
Per field: WPgap = WPtarget - WP (normalized).
For Group/AOI: area-weighted average of field-level WPgap.
For Group/AOI: area-weighted average of field-level WPgap.
When it comes to reviewing outcomes, connecting water use with yield and land productivity is important in order to understand whether water delivery translated into agricultural value.
Water Productivity Target
Represents the optimal Water Productivity for a given crop and yield zone. Calculated via a statistical analysis over the AOI.
When it comes to reviewing outcomes, connecting water use with yield and land productivity is important in order to understand whether water delivery translated into agricultural value.
Metrics Table
Help us
Improve
Your feedback helps us make our Academy more useful. Tell us about your experience and what you'd like to see next.