
IrriWatch | Advisor Navigation
Under Weather, users can view that field’s graphs of daily Precipitation and Air Temperature and GDU.
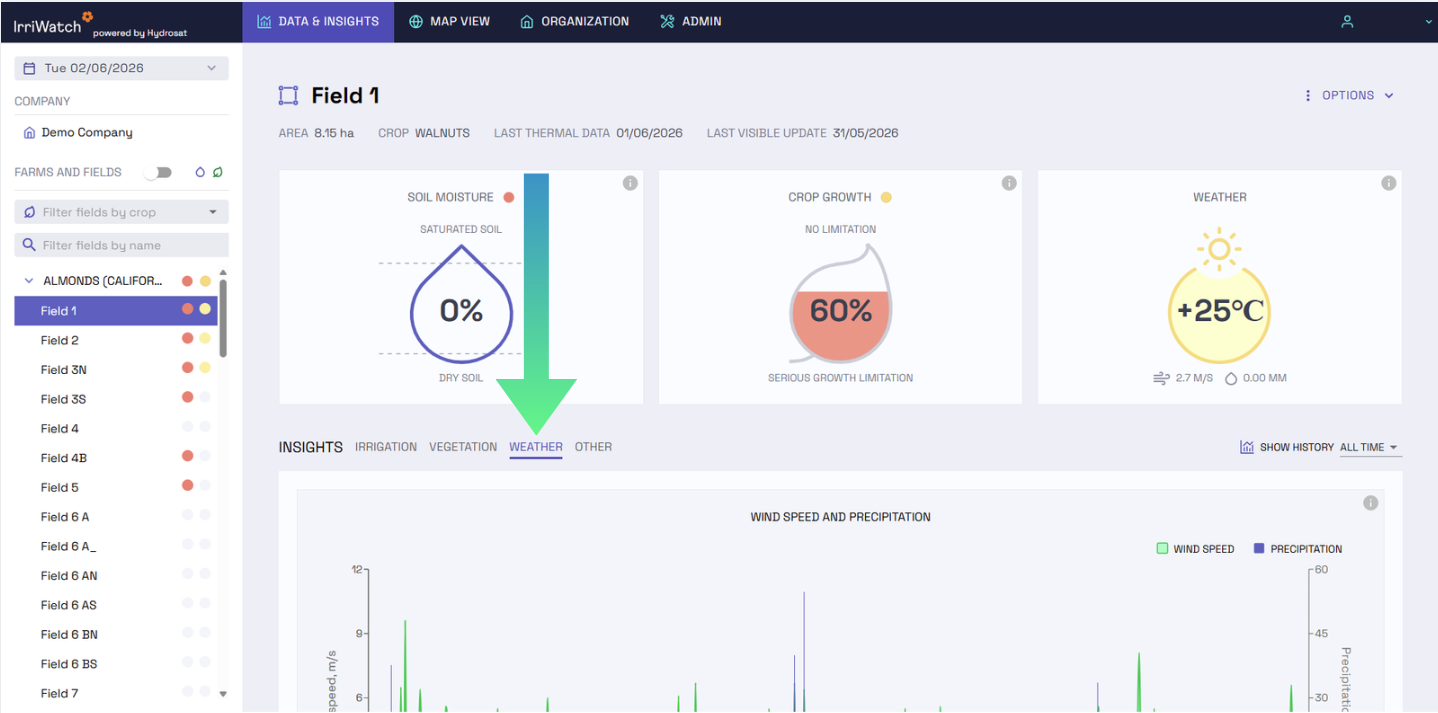
Daily precipitation can be seen as an increase in the cumulative precipitation line between two consecutive days in the Evapotranspiration, Applied Water, and Precipitation Cumulative graph, or as a bar in the Precipitation and Wind Speed graph.
Wind speed, a key factor affecting evapotranspiration (ET) throughout the season, can be viewed on the timeline graph.
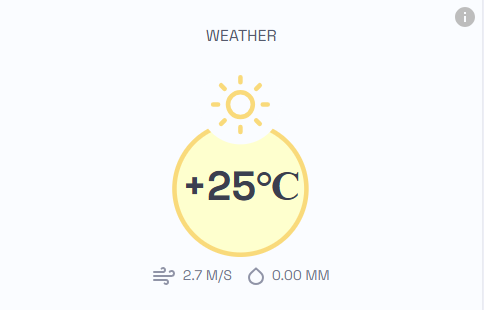
The forecasted wind speed for the current or more recent day is shown in the top-right widget (alongside the forecasted air temperature and estimated precipitation). Understanding the wind speed is important, as it can affect how irrigation suggested
in the irrigation planner or other agricultural practices are carried out today.
Air Temperature and GDU (Growing Degrees Units or days) can help in understanding the daily expected change of various crop bio-physical processes. GDU is accumulated from the planting or sowing day and is used in agriculture to estimate plant growth and development throughout the growing season. It is calculated using the maximum and minimum temperatures, along with a base temperature below which plant growth does not occur.